This is the third in a series of posts (first, next, previous) in which I am exploring five key technology themes which will shape and inform information technology work in the coming decade:
- The Emergence of the Individual Narrative;
- The Increasing Perfection of Information;
- The Primacy of Decision Contexts;
- The Realization of Rapid Solution Development;
- The Right-Sizing of Information Tools.
In today’s post, we will dive into the second in detail: the increasing perfection of information.
The Increasing Perfection of Information
The increasing perfection of information is enabling better decisions.
Data has no value unless communicated – then it becomes information. When we can fit that information meaningfully and usefully into a framework of understanding it becomes knowledge. Better knowledge leads to better decisions.
What do I mean by ‘perfect’ information? Information that has high fidelity to the world, that is complete, accurate, situated in meaningful contexts, that can be drilled into in real-world detail but can also be viewed as part of useful aggregations, that is at your disposal the exact moment you need it without error or lag, and that is communicated in the most readily apprehensible form.
Data about Real Things is a Model of Reality
The data we have about real things is not reality. Data about real corporeal things is a model of reality, a tool we create to help us track and understand part of our world. This can be confusing because we also have data about virtual things, such as claims.
This is important to understand for what follows, so let’s take a minute here and drill down into the nature of data. (This will be familiar territory to readers of this blog – it is a common theme across many posts.)
Take a person for example. Data we have about a person fundamentally consists of four things:
- A digital model of the person – a little digital homunculus – made up of attributes from point-in-time snapshots reported by various means. This digital model includes demographic information – their name, birthdate, gender, sex, height, weight, etc. It also includes their relationships to other individuals, to groups of people, to contracts, to transactions under contracts, and so on. Going forward, as described in the last post in this series, this will be a narrative event history. And it will need to record the provenance, the bona fides, of each data element.
- Our analysis of their behavior and our predictions of their future behavior.
- Communication links – unique locations in given communication spaces such as street addresses, phone numbers, and email addresses that we can use to locate and communicate with the person.
- ‘Indexicals’ – pointers to the person’s identity that we use to associate our model with the world and with other fragments of the model that may exist. Sometimes these are unique identifiers such as ‘Member ID’. Sometimes they are demographic attributes and communication links repurposed.
Data about any physical thing in the world is similar to data about people. Sometimes we don’t care about identity per se – if we have a pile of bricks in a warehouse of a certain size, shape, color, material and quality we may not care if they are exactly the same bricks they were a week ago. But if we have a particular classic Gibson guitar it better be the very same ES-335 today that came out of the Gibson factory in Kalamazoo in 1958.
Data about virtual things is similar to data about real things, except that the original consists only of information.
Let’s say a salesperson takes an order over the phone from a longtime client. The moment they verbally agree, the order exists, even if only as information in their minds.
It is common practice to have the first recorded version be treated as the ‘real’ one. So our salesperson writes the order down on a paper order form. That becomes the operational ‘original’. But even if that is destroyed, the order can survive. The order is an idea, not a thing.
What gets confusing about data about virtual things is that the operational original can exist as a record in a database. We can make perfect copies of it that we keep synchronized with the original. But we can also have records which are models of the virtual thing and point to the operational original.
The thing is, because the operational original exists in data, the records we have which point to the original can contain all the data of the original. So the distinction between original and copy is conventional, and procedural, not logically necessary like it is with real things. If we have two identical copies of a virtual order which one is ‘real’? When the distinction between original and copy blurs we run into data consistency issues. The value of distributed ledgers – of blockchain – is that when all parties agree on One True Version of a virtual thing, that version becomes the actual thing through a kind of digital alchemy. Please see my series on blockchain for a richer exposition.
When an object in the world changes, in order to keep our model current there needs to be an observer to the change, the observation needs to be reported to us, and we need to update our data. In order to manage the updates well we define one system as a so-called ‘system of record.’ The updates are made there, then copied with rigor to other systems called ‘systems of reference.’ Frequently data is then copied in turn to other ever-farther-downstream systems in a daisy-chained game of computer ‘telephone’.
For virtual things, the ‘system of record’ is the operational original we have agreed on.
You may have heard the newer distinction of ‘Systems of Engagement,’ which sprang from the fertile brain of long time Silicon Valley sage Geoffrey Mo0re of “Crossing the Chasm’ fame.
A System of Engagement is a consumer-facing system. As such it not only communicates transaction information to and from Systems of Record in the back office, it is itself the System of Record for the consumer interaction data, which has become increasingly more important.
Building Better Models
As we have seen, data models the world. All models are lossy – they contain less information than the thing being modeled. All models are out of date – it takes time to get data about what is being modeled and to incorporate it into the model.
Higher fidelity models have more information, take longer to build, are more expensive to maintain. A Hot Wheels toy model of a 1958 Corvette Stingray, which you can get on eBay for $3.00, tells us some things about the car – mostly its body shape.

A larger, more detailed Franklin Mint die-cast model with doors, a hood and a trunk which all open, and a detailed dashboard and upholstery, which you can get on EBay for $330, tells us more:

(Of course you could always pick up the real thing – it will run you around $109,000.)

Because of the expertise, time and expense involved in making models, we generally settle for the lowest-resolution model that meets our needs of the moment.
When those needs outstrip the utility of the model, we have no choice but to spend the money to get a better model.
Case in point: ICD-9 and ICD-10. ICD codes are an information model that we use to describe clinical diagnoses and procedures in support of billing.
As one of the few comprehensive data sets describing clinical information we have extended our use of the model to other purposes, such as population health analytics.[1]
ICD-9, consisting of some 15,000 diagnosis codes and 3000 procedure codes, has been replaced by ICD-10, which has 68,000 diagnosis codes and 87,000 procedure codes.
ICD-10 has 4x higher fidelity for diagnoses, and 30x higher fidelity for procedure codes.
ICD-9 is the Hot Wheels Corvette, ICD-10 is the Franklin Mint Corvette. The actual world of diagnosis and procedure is the BuyAVette.Net Corvette.
We have increased the perfection of the information.
The chief driver of the adoption of ICD-10 was that the too-low fidelity of ICD-9 had been costing us money. Its crude model of clinical reality had gaps money was draining out of. And we have had to awkwardly integrate related data at significant expense to spackle those cracks, such as with doctor’s notes.
Just as technology has enabled us to go from the 12” round-cornered cathode ray tube televisions of the 1950’s to today’s 108” 4K LED screens, technology is enabling us to create and use higher and higher resolution models in general.
We model people with a lot more data points now than we did twenty years ago – and the number of data points is going up as we instrument more and more of our existence. One example of this is the fine-grained data capture in ‘systems of engagement,’ which is creating hordes of data about individual behavior and was the original driver of the Big Data revolution.
We are creating more perfect information.
Sharing Models
Models consist of the form or structure of the model, and the actual populated instances of that structure. In our Corvette example above, we might have a host of Hot Wheels models, for example. All have common structural elements, such as plastic wheels-and-tires-as-single-units that spin on wire axles.
For information models, the common structure consists largely of the definition of a set of attribute values – name, birthdate, etc. (In a future post I will describe how innovation in the theories of concepts and categories will revolutionizing modeling and data structures.)
If I have a model of a person in my data, and you have a model of a person in your data, it seems patently, painfully, laughably obvious that it would be beneficial for us to share a common model.
First, models are expensive to design and build. We could share the expense. And not just you and I. Everyone who was modeling the same thing could share the expense.
And second, if our models matched, we could easily share and combine our data. And not just you and I. Everyone who was modeling the same thing could easily share data.
And the risk of not sharing a common model is that without it we are less sure we are talking about the same thing – there is always a translation from model to model that has to happen.
So why don’t we do always use common models?
There are some IT-cultural barriers – American IT cultural barriers, not Cambia ones – to dealing in levels of abstraction. I will talk more about those in the coming section on the realization of rapid application development. There is also the ‘not-invented-here’ syndrome, a belief that our understanding of a business space is different, better, that that is part of our competitive advantage, which we might lose in sharing. Sometimes the ‘here’ in ‘not-invented-here’ is America and the two reasons meld[2].
But the main reason is money. First, the money that has been invested in the legacy IT environment and the time and money it would take to rip and replace. And second, the time and money it would take to build the new model, and the challenges in selling the ROI on the effort.
So instead our – our company’s, our industry’s, our country’s – common modeling effort has come in the integration space.
HIPAA transaction standards – 837 claims, 820 enrollments – are shared standard models whose use is mandated by law.
Let’s take a little time to look at common modeling approaches to better understand the challenges.
Ontologies
Computer science has borrowed the word ‘ontology’ from philosophy, where it means the study of the structure implied by the concepts of metaphysics such as being, becoming, and existence.
In computer science it means “a formal naming and definition of the types, properties, and interrelationships of the entities that really or fundamentally exist for a particular domain of discourse”[3].
But we usually call elements of it ‘data models’ and ‘business rules’ (some of them), ‘taxonomies’, and ‘vocabularies’.
To be clear, ontologies always exist. We just don’t always write them down.
Let’s say I have a database to hold claims. It consists of two tables, one for the common ‘header’ information, and another for the claim lines. I have a database constraint in place that won’t permit the creation of a claim with no lines. There is an implied model behind that structure – a medical claim consists of a body of information about a medical service performed for a given patient by a given provider at a particular time and place with at least one line describing a procedure performed.
That model exists independently of that database. That implied model describes the business entity, the virtual thing called a ‘claim’, which, like a Platonic form, exists independently of all databases that hold claims.
An ontology is a common conceptual model that describes all of a business domain, the entities and the fundamental rules for their evolutions and their interactions, independently of all the implementation designs for holding its data and effecting its actions.
We rarely go to the time and expense of building an ontology, leaving it instead as a shared construct in the imaginations of the business and IT people working on a given solution. Instead we create so-called ‘logical’ models, which are ontological fragments usually imbued with the implied constraints of the target implementation.
Building a large ontology is very hard to do – one of the hardest things in IT to do. Many senior IT people have war stories of failed ontology projects. This has made us gun-shy as an industry about going there. Tim Berners-Lee’s vision of a semantic web is on a long, slow ramp to realization.
But ontologies are deeply felt in their absence. Domain errors and inconsistencies in our databases, missed requirements, the difficulty in implementing common business rules, all have some grounding in the failure to specify and maintain the specification of a business domain independently of specific implementations.
Lingua Franca
One area where an ontological approach is gaining traction in the integration space.
In practical terms, an integration ontology describes a lingua franca.

The original lingua franca, the Mediterranean Lingua Franca (also called ‘Sabir’), was the language of commerce in the Mediterranean region for most of the 2nd Millennium. A pidgin made up of words from a dozen languages, mostly Italian (where most of the money was : ), it was understood on every ship and in every port of call.
If we want to integrate, to orchestrate, discrete distributed functions, if we want to federate existing solutions, they need to all speak the same language. Creating a common ontology for each integration domain is the minimum necessary path to doing that well.
The use of this pattern – the implementation of an integration ontology – in software engineering is called ‘Canonical Modeling.’
Near-Real-Time
To the extent time passes from an object’s change to our recording of it our data is out of date. To the extent time passes from the update of our system of record to the updates of our systems of reference our data is inconsistent. To the extent time passes from an event to which we want or need to respond and our awareness of it opportunity is lost, sometimes critically.
Our primary means of updating our systems of reference is batch data transfers that happen on an arbitrary schedule, usually daily. As long as we use batch, our systems of reference are always out of date parts of days, days, weeks or months. As long as we use batch to communicate events we risk being a day late and a dollar short.
That was fine in 1970. It won’t get it done in the fully-connected decade of the 2020’s.
For that we need near-real-time[4].
Transaction data consist of events. An event is a noteworthy change in the recorded state of an entity. There is a new claim. A person’s address changes. A stock price changed.
Batch integration ‘saves up’ events until some arbitrary time when a scheduling program wakes up an application (‘batch job’) that reads the events from a database and writes them out to a file (‘batch file’) on some well-known directory. The next job in the chain wakes up, take the file, and sends it on down the line. Sometimes that line spans the Internet via a secure file transfer protocol (‘FTP’). Eventually the set of events in the form of the file reaches its destination where it is loaded into the target database where the entities whose states were changed are updated.
A batch file is simply a collection of events that are arbitrarily dealt with as a chunk because it used to be cheaper and easier to do that.
Near-real-time consists of exactly the same events. But instead of saving them up for later, as soon as they happen we take each individual event, wrap it in a data envelope called a ‘message’, and put it on a queue for delivery. There is plumbing in place to get the message to where it needs to go as quickly as our capacity allows.
The ‘where they need to go’ is a ‘service’. More about those in the coming section of the realization of rapid application development.
Event processing is having a renaissance as our technology catches up with our vision. Please see this series of posts for more on that.
A Sporting Example
Let’s look at an example of the increasing perfection of information: the capture and use of statistics in the National Basketball Association.
The knowledge NBA coaches and general managers are seeking is how to win more often.
The primary operational choices they have are what players to employ, when to play them, what positions to play them at, and what offenses and defenses to run and when.
In the early days of the NBA not many statistics were recorded, and all were recorded manually. The statistics captured were counts per player of minutes played, shots attempted and made, free throws attempted and made, rebounds captured, personal fouls committed, and assists delivered.
Wilt Chamberlain, who played from 1959 until 1973, may have been the best shot-blocker and offensive rebounder of all time, but there is no way to know for sure – blocked shot and offensive rebound stats were not kept while he was active[5].
There wasn’t much more data available than was captured in the familiar box score from the newspaper (this one a famous Chamberlain game of March 2, 1962 basketball fans will recognize):

By the time Inderpal Bhandari, now Chief Data Officer for IBM Global, and his team at IBM’s TJ Watson Research Center developed Advanced Scout, the data-mining application first used by the NBA in the 95-96 season, the set of core statistics had been expanded to include the distinction between offensive and defensive rebounds, blocked shots, steals and turnovers.
But to make the data mining with Advanced Scout useful and effective, more detail had to be captured: the time and location when and where actions occurred. This is another example of the theme I mentioned in the last post in this series, time detail being added to a data set driven by the need for analytics.
Now from the extended body of more highly detailed, longitudinal data useful inferences could be drawn, such as what players matched up most favorably against which defenders.
The most powerful use of Advanced Scout was in the correlation of the data with videotapes of the games. Interesting periods of time identified in data mining could be quickly brought up on video. At its peak (circa 2001) 25 out of 29 teams were using the software.
Now, almost 20 years later, that early work is largely forgotten, and the use of analytics in sport has become common, and still controversial, practice. The movie Moneyball famously provides a look into the advent of sophisticated analytics in baseball. New statistics such as BABIP and DER are used by fans and teams alike.
Basketball has reinvented its data mining approach. Kirk Goldsberry, who used to teach geography at Michigan State and Stanford, and who is a lifelong basketball fan, developed an analytics approach he called ‘CourtVision’ which he presented in a sports statistics conference at MIT Sloan in 2012, analyzing shot location data posted on ESPN.com.
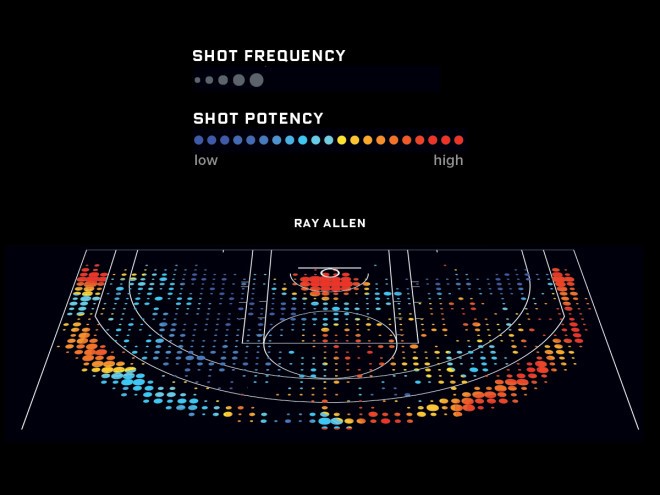
Basketball movers and shakers attending the conference, such as Mark Cuban, owner of the Dallas Mavericks, were intrigued. But CourtVision also caught the attention of Brian Kopp, an executive at Stats, LLC. in Chicago, the leading sports statistics company in the US. Stats LLC was developing a technology called ‘Player Tracking’ . According to the NBA:
Using six cameras installed in the catwalks of every NBA arena, SportVU software tracks the movements of every player on the court and the basketball 25 times per second. The data collected provides a plethora of innovative statistics based around speed, distance, player separation and ball possession. Some examples include how fast a player moves, how far he traveled during a game, how many touches of the ball he had, how many passes he threw, and how many rebounding chances he had.

After Goldsberry demonstrated the following year how the SportsVU data could be utilized, the NBA leadership adopted it for all teams in the league.
The next evolution in basketball stats will be to have the analysis done near real time on the stream of data as it is captured, providing sophisticated information to the coaches while the game is being played, supplementing analysis done beforehand, and enabling them to make better decisions during the game.
The Path to Perfection
Let’s recap the path to more perfect information.
First, technology is enabling a higher and higher level of instrumentation – we are gathering more and more raw data at a finer and finer grain about the world. Cell phones give us personal location data. Fitness bands give us steps and heart rates. As of 2011 there were an estimated 1.85 million surveillance cameras installed in the United Kingdom[6].
Data largely exists as models of the real and virtual worlds. We are creating more and more accurate and detailed models more inexpensively. Modeling standards such as enterprise and industry canonical models are facilitating the exchange of data.
The increasing speed and bandwidth of the internet combined with the increasing adoption of integration standards (APIs for machine to machine communication) is making it faster and easier to communicate that data.
The expanding ability to apply well-known analytic algorithms to large volumes of distributed data (Big Data) is helping to turn that information into knowledge. One example of this: the footage from those 1.85 million video cameras in the UK is being turned into knowledge with facial recognition software, which is getting better and better at identifying and tracking individuals.
Next up, we will look at the third of our five key technology themes for the coming decade: the architectural primacy of decision contexts.
[1] We’ve really stretched the ICD code model’s utility thin over the years – ICD codes were not even originally designed for billing, but for communicating disease and morbidity statistics for a nation to the world health community. The late Virgil Slee, at the time arguably the nation’s leading expert on health coding systems – and one of my personal heros in our industry – argued vehemently but futilely in favor of fixing the ‘overloading’ of ICD codes by creating separate billing and clinical coding schemas.
[2] The history of the Basel accords – an international set of recommendations for banking and insurance regulation to help prevent the financial fiascos that led to the Second Great Depression – is a prime example.
[3] https://en.wikipedia.org/wiki/Ontology_(information_science)
[4] The difference between ‘near-real-time’ and ‘real-time’ in software engineering is this. Real-time transactions have to succeed within their allotted window of time or they fail and alarms go off – think flight-control software, or software-controlled oxygen delivery systems. But near-real-time transactions have to mostly happen within their allotted window of time – usually some agreed-on service level agreement like 97.5% of the time. But if they don’t, if a given transaction is slow, it can still succeed. When we say ‘real-time’ in a business software context we mean ‘near-real-time’.
[5] For you basketball fans, there were enough stats captured to note triple-doubles – double figures in points, rebounds and assists in a single game. Oscar Robertson, the best player ever, just ask him, averaged a triple double – 31 points, 12.5 rebounds, and 11.4 assists per game – for Cincinnati his rookie 1961-62 season – a feat not repeated until Russell Westbrook’s three season run from 2016 – 2019.
[6] http://www.securitynewsdesk.com/2011/03/01/only-1-8-million-cameras-in-uk-claims-acpo-lead-on-cctv
